Cornish-Fisher Value at Risk (VaR): A Smarter Way to Estimate Portfolio Losses

by | Jun 2, 2025 | Investing Tools and Regulations | 0 comments

Discover how Cornish-Fisher VaR refines traditional risk assessment by accounting for skewness and kurtosis in financial returns.

Introduction

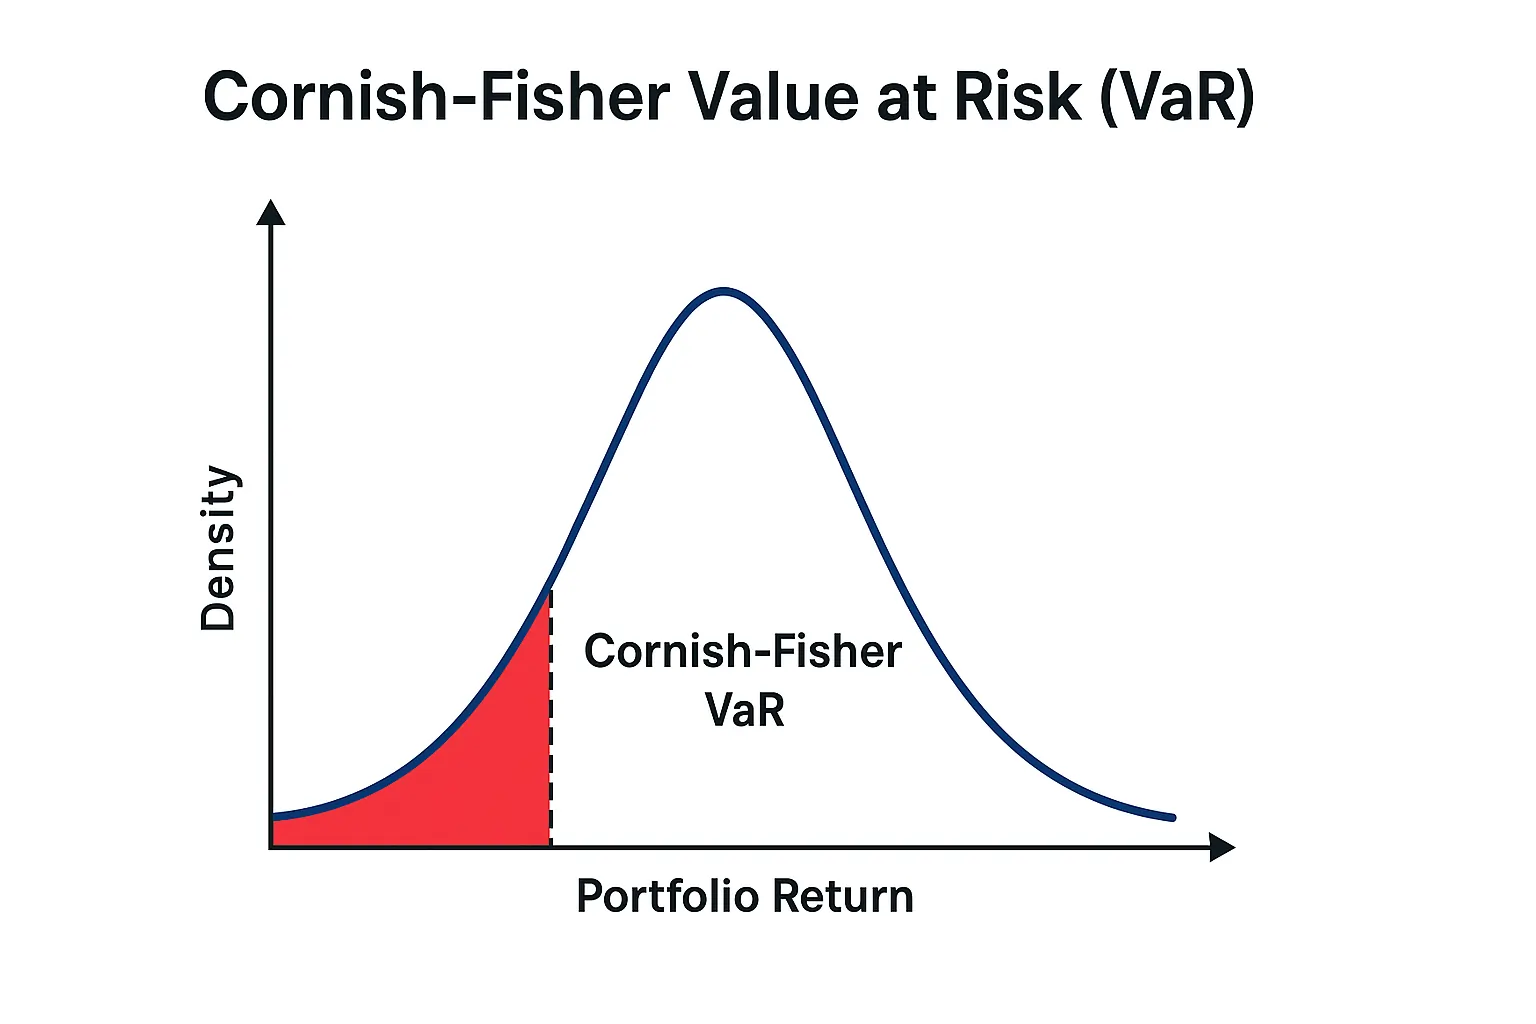
Value at Risk (VaR) is a fundamental metric used to estimate potential losses in a portfolio over a given time frame with a specified confidence level. However, the traditional approach assumes returns follow a normal distribution—a condition rarely met in real-world markets. This is where Cornish-Fisher VaR comes in, enhancing the model by incorporating skewness and kurtosis to more accurately reflect extreme events.

What Are Skewness and Kurtosis?

Skewness and kurtosis are statistical concepts that help describe the shape of a distribution — especially important when dealing with financial returns, which often deviate from the ideal bell curve (normal distribution).

Skewness – Measuring Asymmetry

Skewness tells us how symmetrical the distribution is:

  • A skewness of 0 implies a perfectly symmetrical distribution.
  • A positive skew (right-skewed) means the right tail is longer; extreme positive returns are more likely.
  • A negative skew (left-skewed) means the left tail is longer; large losses are more probable.

In investing, a negative skew is concerning because it indicates a higher chance of extreme losses.

Kurtosis – Measuring Tail Thickness

Kurtosis measures the “tailedness” of the distribution — how much of the variance is due to extreme deviations.

  • Normal distribution kurtosis = 3
  • Excess kurtosis = Kurtosis – 3
  • A high positive excess kurtosis indicates fat tails — more frequent extreme outcomes (both gains and losses).
  • A low kurtosis suggests fewer extreme outliers than a normal distribution.

In practice, if returns have high kurtosis, there’s a greater chance of tail events — think market crashes or massive gains.

What Are Tail Events?

In finance, “tail events” refer to rare and extreme outcomes — either very large gains or (more often) very large losses — that occur in the tails of a probability distribution.

Why “Tail”?

Imagine a bell curve (normal distribution):

  • The center represents the most common, average outcomes.
  • The “tails” on the left and right represent extreme outcomes — far from the average.
  • Tail events are in those extreme ends.

Examples of Tail Events in Real Life:
  • A stock market crash like Black Monday (1987) or the 2008 financial crisis.
  • A company’s stock plummeting 80% in one day due to a fraud revelation.
  • A sudden 10x gain from a biotech firm after FDA approval (rarer, but possible).

These events are unlikely but impactful. Traditional models like standard VaR often underestimate their frequency and severity, because they assume returns follow a normal distribution (thin tails).


Why Tail Events Matter in Risk Management:
  • Traditional VaR assumes normality → underestimates risk of extreme losses.
  • Cornish-Fisher VaR adjusts for skewness (asymmetry) and kurtosis (fat tails), making it better at capturing tail risk.

So, tail events are at the heart of why Cornish-Fisher VaR is more realistic and useful than the basic VaR in many market environments.

What is Traditional VaR?

Traditional VaR (Variance-Covariance method) assumes normality and calculates potential loss as:
VaR = Z × σ × √t
Where:
– Z is the z-score for the confidence level (e.g., 1.65 for 95%)
– σ is the portfolio’s standard deviation
– t is the time horizon

Limitations of Traditional VaR

Financial returns often exhibit skewness (asymmetry) and excess kurtosis (fat tails), meaning extreme losses are more probable than a normal distribution suggests. Traditional VaR underestimates these risks.

Cornish-Fisher Expansion Explained

The Cornish-Fisher method adjusts the Z-score used in the VaR calculation to account for skewness (S) and kurtosis (K). The adjusted Z is calculated as:

Z_cf = Z + (Z² – 1)S / 6 + (Z³ – 3Z)(K – 3) / 24 – (2Z³ – 5Z)S² / 36

Then, the Cornish-Fisher VaR is:
VaR_CF = Z_cf × σ × √t

Practical Example

Assume:
– Portfolio value: €1,000,000
– Daily volatility: 2%
– Skewness: -1.2
– Kurtosis: 6
– Time horizon: 1 day
– Confidence level: 99% → Z = 2.33

Using Cornish-Fisher, the adjusted Z_cf ≈ 2.8
VaR_CF = 2.8 × 0.02 × √1 = 5.6% = €56,000
Compared to:
Traditional VaR = 2.33 × 0.02 = 4.66% = €46,600

Key Differences

– Traditional VaR assumes normal returns; Cornish-Fisher allows for non-normality
– Cornish-Fisher is more accurate under market stress
– Better tail-risk estimation

When to Use Cornish-Fisher VaR?

Use Cornish-Fisher when managing portfolios with significant skew/kurtosis, such as in hedge funds, options portfolios, or during periods of market turbulence.

Conclusion

Cornish-Fisher VaR gives investors a more nuanced view of risk in the presence of skewness and fat tails. While more complex, it delivers more realistic estimates of potential losses, especially in volatile markets.

→ Want more insights like this? Join our free newsletter and stay ahead of the curve.

Stay ahead of the market. Manage risk intelligently. Be part of the bullish side.

Discover More

For more insights into analyzing value and growth stocks poised for sustainable growth, consider this expert guide. It provides valuable strategies for identifying high-potential value and growth stocks.

We also have other highly attractive stocks in our portfolios. To explore these opportunities, visit our investment portfolios.

This analysis serves as information only and should not be interpreted as investment advice. Conduct your own research or consult with a financial advisor before making investment decisions.

Looking to Educate Yourself for More Investment Strategies?

Check out our free articles where we share our top investment strategies. They are worth their weight in gold!


📖 Read them on our blog: Investment Blog

For deeper insights into ETF investing, trading, and market strategies, explore our library or go to Lulu.com for each guide:

📘 ETF InvestingETFs and Financial Serenity
📘 Technical TradingThe Art of Technical & Algorithmic Trading
📘 Stock Market InvestingUnearthing Gems in the Stock Market
📘 Biotech Stocks (High Risk, High Reward)Biotech Boom

You may also be interested in …

🔥 Missed the Rally? This Stock May Explode in Q3!

🔥 Missed the Rally? This Stock May Explode in Q3!

Feeling the FOMO yet? While most investors are distracted by the noise, smart money is quietly positioning itself on a stock with breakout potential. Our latest analysis uncovers a hidden gem showing strong fundamentals, bullish momentum, and powerful upcoming catalysts. From technical setups to insider accumulation, everything points toward a major price move.

We break it all down: financial health, earnings growth, and why this opportunity could outperform the broader market in Q3 and beyond. Don’t wait until the mainstream catches up.

👉 Stay ahead of the curve. Visit bullishstockalerts.com now for the full analysis and real-time updates.

read more
🚀 China’s Factory Rebound Sparks Export Surge—Is Your Portfolio Ready?

🚀 China’s Factory Rebound Sparks Export Surge—Is Your Portfolio Ready?

China’s unexpected factory surge is shaking global markets—and smart investors are already positioning themselves. While official reports painted a bleak picture, the Caixin PMI tells a different story: export-driven growth is accelerating, and momentum is building fast. This isn’t just another economic rebound—it’s a signal. A signal for traders and investors to seize new opportunities before the crowd catches on.

Explore our exclusive breakdown of market sentiment, technical targets, and macro catalysts that could shape Q3 and Q4. From ETF positioning to leveraged plays on industrial recovery, we deliver real-time insights that go beyond the headlines.

Don’t miss the next wave—tap into expert-backed alerts and actionable strategies now at 👉 bullishstockalerts.com.

read more
Ride the Surge Before It’s Too Late: A Once-in-a-Generation Investment Opportunity

Ride the Surge Before It’s Too Late: A Once-in-a-Generation Investment Opportunity

What if the next big investment opportunity isn’t a tech giant… but something hiding in plain sight? As market volatility shakes confidence and the dollar weakens, a new wave of smart money is flowing into an underrated asset class. With gold rebounding, oil adjusting, and Asian markets gaining momentum, this may be your last chance to enter before the real breakout.

Inside this in-depth market analysis, we reveal our multi-timeframe target prices, technical signals, and the macroeconomic catalysts lining up for a potential surge. You’ll understand why this asset could outperform the S&P 500 over the next 3 to 12 months — and how to position yourself wisely.

Don’t watch from the sidelines.

👉 Join the movement at bullishstockalerts.com and stay ahead of Wall Street.

read more
The Central Bank Storm: Are You Ready for the Next Big Market Shock?

The Central Bank Storm: Are You Ready for the Next Big Market Shock?

Markets are shifting fast—and so should your strategy. With the European Central Bank (ECB) at the center of key macroeconomic decisions, and Christine Lagarde hinting at major uncertainties in trade, inflation, and growth, smart investors know it’s not time to sit back.

While the Euro hits its highest level since 2021 and market indexes across Asia and Europe react, the real question is: are you positioned to benefit?

This moment isn’t just another headline—it’s your signal. Dive into our latest analysis featuring target prices across timeframes, technical trends, macroeconomic catalysts, and actionable opportunities you won’t find in mainstream media. Whether you’re bullish on EUR/USD or eyeing upcoming policy moves, this is your edge.

👉 Ready to turn insights into gains?
Explore exclusive forecasts and daily alerts now at: bullishstockalerts.com – where smart capital goes to grow.

read more
Is the Trump Tax Bill a Blessing or a Blow? Here’s What Investors Need to Know

Is the Trump Tax Bill a Blessing or a Blow? Here’s What Investors Need to Know

Are you ready for the second-half shakeup? With volatility surging and central banks back in the spotlight, the smart money is already moving. From under-the-radar European outperformers to geopolitical catalysts reshaping global risk, now is the time to stay ahead of the curve.

In this week’s market pulse, we break down:

Tactical trade setups with clear entry & stop-loss levels

Multi-timeframe target prices from swing to long-term

Key economic events you can’t afford to ignore

Macro insights fueling the next major sector rotation

Don’t trade blind. Unlock premium analysis, curated alerts, and AI-powered insights that top investors trust.

🔥 The next big move is already unfolding. Will you catch it?
Join us at 👉 bullishstockalerts.com – your edge starts here.

read more
The Second Half Surge: Why Volatility Could Be the Opportunity of the Year

The Second Half Surge: Why Volatility Could Be the Opportunity of the Year

Markets are entering a make-or-break phase. After a wild first half of 2025 filled with black swan events, tariff twists, and political showdowns, the second half promises even more explosive moves. With the ECB Forum in Sintra and U.S. Fed tensions heating up, investors are bracing for central bank shocks, rising volatility, and sudden trend reversals.

Goldman Sachs is sounding the alarm: brace for elevated policy risks and extreme equity swings. Yet amid this chaos, some indices—like Germany’s DAX—are quietly outperforming, hinting at deeper shifts beneath the surface.

The question is: Will you ride the next wave or miss the breakout entirely?
Don’t trade blind. Join the movement of forward-thinking investors who turn uncertainty into opportunity.

👉 Unlock market insights and premium alerts now at bullishstockalerts.com

read more

0 Comments

Submit a Comment

Your email address will not be published. Required fields are marked *

An abstract, dynamic depiction of a bullish market trend, characterized by sharp, angular shapes in shades of gold and brown, suggesting upward movement and growth.

Join our newsletter for exclusive, high-value portfolio tips!

Unlock the secrets to a thriving portfolio with our exclusive newsletter! Be the first to receive cutting-edge investment tips, expert analysis, and insider insights that will elevate your investment strategy. Don’t miss out on the opportunity to maximize your returns – subscribe now and transform your financial future!

Thank you for subscribing! You're now on your way to receiving the best investment tips and market insights directly to your inbox.