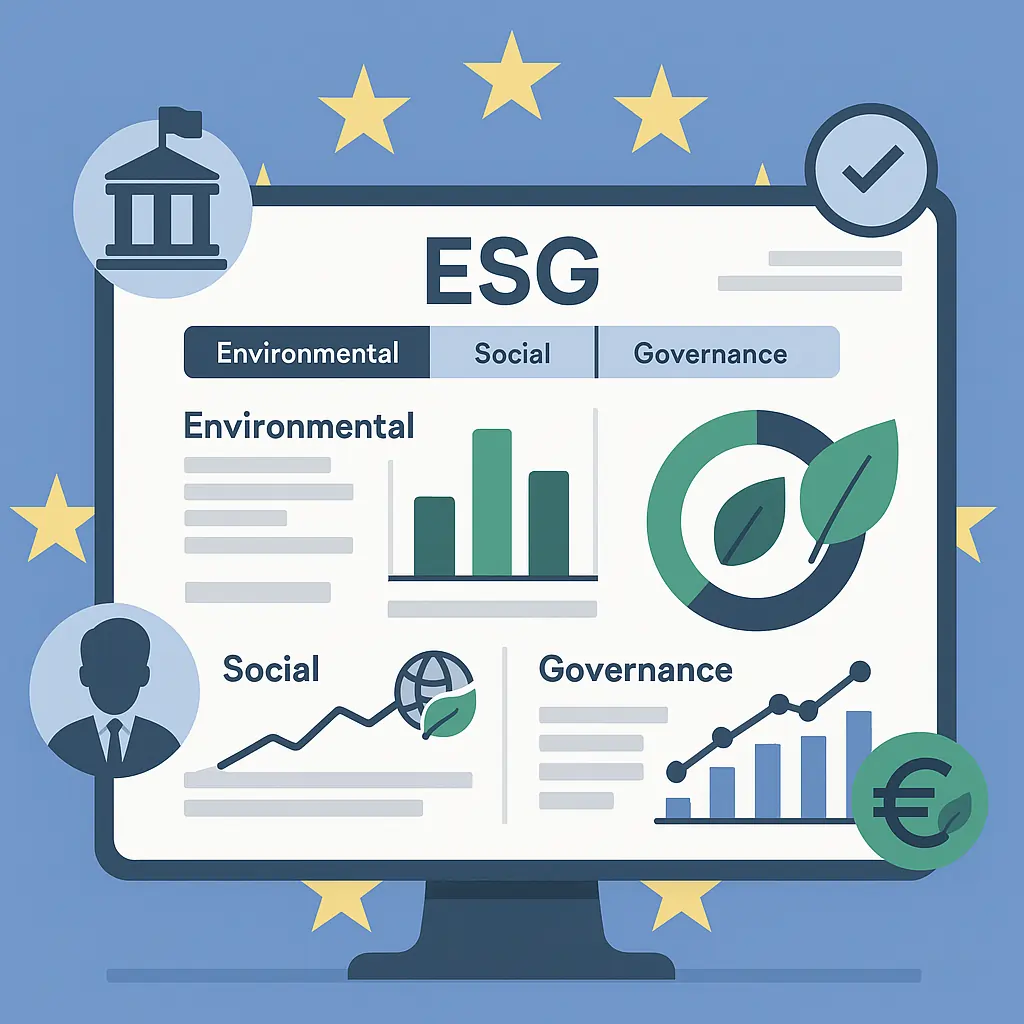
The Corporate Sustainability Reporting Directive (CSRD) represents a fundamental shift in how companies disclose their impact on Environmental, Social, and Governance (ESG) dimensions. While initially perceived as a compliance burden, CSRD also brings forward an unprecedented opportunity to reshape how investors assess risk and value creation. In this in-depth article, we analyze the CSRD through the lens of an investment company, unpacking both its regulatory framework and its transformative potential on portfolio construction and risk management.
The CSRD in Context: From NFRD to a New ESG Era
The CSRD is not an isolated initiative; it’s part of a broader European regulatory agenda aimed at embedding sustainability into the heart of financial and corporate activity. It succeeds the Non-Financial Reporting Directive (NFRD), which was deemed too narrow in scope, lacking comparability and auditability. CSRD addresses these shortcomings by introducing a standardized, auditable, and mandatory framework—anchored in the European Sustainability Reporting Standards (ESRS)—that mandates more robust disclosures across ESG metrics.
The CSRD complements two other regulatory pillars:
- SFDR (Sustainable Finance Disclosure Regulation) – targeting financial market participants.
- EU Taxonomy – a classification system to determine which economic activities can be considered sustainable.
Together, these regulations create a harmonized ESG reporting ecosystem, establishing a new language for sustainable finance.
Why CSRD Matters for Investment Firms
Investment companies, particularly Public Interest Entities such as banks and insurers, are directly affected by the CSRD due to their systemic impact on financial markets. Beyond regulatory compliance, CSRD is a tool for mitigating sustainability risks that are increasingly material to portfolio performance. The Orpea scandal serves as a cautionary tale—ESG failures can quickly lead to loss of investor trust and value.
By forcing companies to disclose ESG risks and opportunities, CSRD aligns investment analysis with long-term resilience and ethical accountability.
The Core Concepts: Double Materiality and the ESRS Framework
At the heart of the CSRD lies the principle of double materiality:
- Financial materiality assesses how sustainability issues affect the company’s financial performance.
- Impact materiality evaluates how the company’s operations and investments affect society and the environment.
Investment firms must report on both axes, offering a 360-degree view of risk and impact.
The ESRS framework is structured to reflect this dual view and includes specific standards for:
- General Disclosures (ESRS 1 and ESRS 2)
- Topical Standards (e.g., climate change, pollution, biodiversity, workforce, communities)
These disclosures cover the full value chain: from operational activities and internal governance to downstream investments.
Methodology: From Value Chain Mapping to Materiality Thresholds
A central challenge for investment firms is to assess the sustainability performance of their entire value chain, including portfolios and third-party asset managers. This requires:
- Mapping the Value Chain
For instance, insurers must consider both their underwriting activities and the environmental/social impact of their investment portfolios. - Performing Double Materiality Assessment
This involves identifying significant impacts and risks across ESG categories, then applying materiality thresholds (e.g., 7.5% of portfolio exposure to a risk factor). - Building the Impact Matrix
Investments are evaluated based on sectoral ESG risk using datasets such as:- UNEP FI’s ENCORE database (for environmental impact)
- UNEP FI tools (for social and governance factors)
This data is then cross-referenced with the portfolio allocation using NAICS codes or NACE classifications to establish material ESG exposures.
From Data to Decision: The Practical Tools
To operationalize this framework, firms like Amandis have developed proprietary platforms that integrate:
- Impact assessments
- Risk analysis
- Financial performance tracking
This allows investment teams to:
- Visualize ESG impacts across portfolios
- Filter investments by ESG severity
- Set dynamic thresholds for disclosure
- Generate automated reports for CSRD compliance
For example, if an equity portfolio contains a 10% allocation to ASML (which has a high ESG impact in toxic waste due to semiconductor manufacturing), the platform flags this under ESRS E4. The firm then decides whether to:
- Divest
- Engage with the company to improve practices
- Offset the exposure through impact investing
Quantifying Impact: Emissions and Beyond
One of the most crucial and quantifiable indicators under CSRD is Greenhouse Gas (GHG) emissions, which must be calculated across:
- Scope 1 (direct emissions)
- Scope 2 (indirect emissions from energy)
- Scope 3 (upstream and downstream emissions)
Investment companies compute their portfolio’s carbon footprint through:
- Investment-specific approaches, using exact ownership stakes and company-level emissions data.
- Proxy-based methods, using sectoral emission factors when direct data is unavailable.
Other indicators include:
- Carbon Intensity
- Waste generation
- Water use
- Job creation and community impact (Social ESRS)
Visualization and Evolution: Monitoring Over Time
A major benefit of integrated platforms is the ability to monitor ESG impact dynamically over time. Firms can track how portfolio rebalancing affects:
- Environmental footprint (e.g., drop in E1 – Climate Change from 15% to 10% impact)
- Social risk exposure
- Governance structures
This helps investment managers make informed strategic decisions and align with fiduciary responsibilities, all while fulfilling regulatory obligations.
Challenges and Opportunities
Key Challenges:
- Data Gaps: ESG data remains fragmented, inconsistent across providers.
- Complexity: The ESRS taxonomy includes dozens of factors; building the right indicators requires expertise.
- Cost: High-quality ESG data licenses are expensive; public databases provide a valuable, if less precise, alternative.
Strategic Opportunities:
- Cost Reduction through targeted reporting (only disclose material topics).
- Operational Efficiency via automation and internal collaboration.
- Competitive Advantage by positioning as a sustainable, responsible investment firm.
The Road Ahead
The CSRD is not merely a compliance exercise—it’s a paradigm shift in how investors perceive value, impact, and risk. Firms that embrace it early can transform regulatory pressure into strategic insight and stakeholder trust.
Investment firms must stop treating ESG reporting as a box-ticking exercise. With the right tools and mindset, it becomes a new lens for portfolio optimization, risk reduction, and sustainable growth.
Conclusion
The CSRD challenges the financial sector to move beyond short-termism and embrace a broader definition of success—one that considers planetary boundaries, societal cohesion, and responsible governance. With regulatory clarity, analytical rigor, and digital tools like those developed by Amandis, investment firms are equipped to turn compliance into a compass for long-term value creation.
Sustainability is no longer a niche—it’s becoming the norm. The CSRD is here to ensure that norm is built on transparency, accountability, and measurable impact.
Discover More
For more insights into analyzing value and growth stocks poised for sustainable growth, consider this expert guide. It provides valuable strategies for identifying high-potential value and growth stocks.
We also have other highly attractive stocks in our portfolios. To explore these opportunities, visit our investment portfolios.
This analysis serves as information only and should not be interpreted as investment advice. Conduct your own research or consult with a financial advisor before making investment decisions.
Looking to Educate Yourself for More Investment Strategies?
Check out our free articles where we share our top investment strategies. They are worth their weight in gold!
📖 Read them on our blog: Investment Blog
For deeper insights into ETF investing, trading, and market strategies, explore our library or go to Lulu.com for each guide:
📘 ETF Investing: ETFs and Financial Serenity
📘 Technical Trading: The Art of Technical & Algorithmic Trading
📘 Stock Market Investing: Unearthing Gems in the Stock Market
📘 Biotech Stocks (High Risk, High Reward): Biotech Boom


0 Comments