Sortino vs. Sharpe: Why Downside Risk Matters More Than You Think

by | Jun 1, 2025 | Investing Tools and Regulations | 0 comments

Introduction

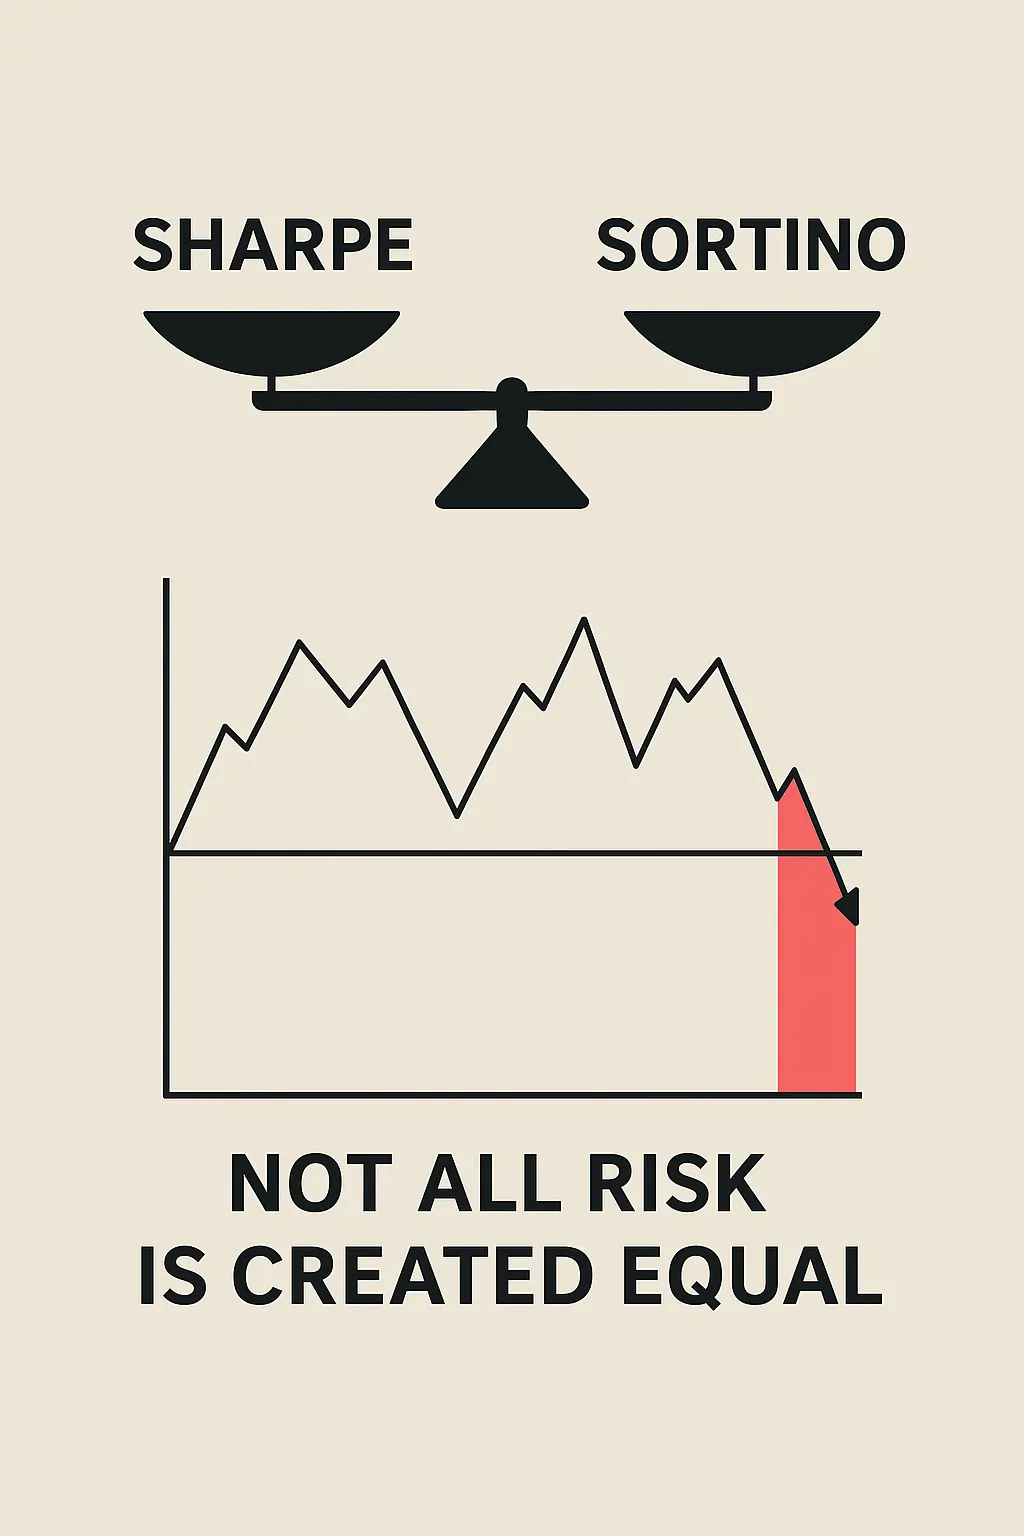
In the world of portfolio management and risk-adjusted returns, the Sharpe Ratio has long been a go-to metric. But is it truly the best way to measure investment performance? Enter the Sortino Ratio — a more nuanced, downside-focused version that many argue paints a clearer picture of risk.

In this article, we’ll explore the key differences between the Sharpe and Sortino ratios, explain how they work, and illustrate why focusing on downside risk may be more relevant for modern investors.


What Is the Sharpe Ratio?

Definition and Formula

The Sharpe Ratio measures the return of an investment compared to its total volatility. It’s calculated as:

Sharpe Ratio = (Rp - Rf) / σp

Where:

  • Rp = Portfolio return
  • Rf = Risk-free rate (e.g., U.S. T-Bill)
  • σp = Standard deviation of portfolio returns (total volatility)

Purpose

The Sharpe Ratio tells us how much excess return we get per unit of risk. The higher the ratio, the better the risk-adjusted performance.

Limitations of Sharpe

  • Penalizes upside volatility the same way it penalizes downside volatility
  • Doesn’t distinguish between “bad” and “good” risk
  • Can be misleading in asymmetrical return distributions (e.g., hedge funds, options)

What Is the Sortino Ratio?

Definition and Formula

The Sortino Ratio is a variation of the Sharpe Ratio, but it only considers downside deviation — the part investors actually fear. Here’s the formula:

Sortino Ratio = (Rp - Rf) / σd

Where:

  • σd = Downside deviation (only standard deviation of negative returns below a defined threshold)

Why It Matters

Unlike the Sharpe Ratio, the Sortino Ratio doesn’t penalize positive volatility. It reflects a truer picture of risk, especially for portfolios that aim for asymmetric returns (e.g., growth funds or alpha-seeking strategies).


Real-World Example: Sharpe vs. Sortino in Action

Let’s compare two portfolios:

MetricPortfolio APortfolio B
Annual Return (%)1212
Risk-Free Rate (%)22
Standard Deviation (%)1010
Downside Deviation (%)85

Sharpe Ratio for both = (12 – 2) / 10 = 1.0
Sortino Ratio A = (12 – 2) / 8 = 1.25
Sortino Ratio B = (12 – 2) / 5 = 2.0

Interpretation:

While both portfolios have the same Sharpe ratio, Portfolio B takes on less downside risk. The Sortino Ratio reveals this advantage clearly, making it more relevant for risk-sensitive investors.


When Should You Use Sortino Over Sharpe?

Situations Where Sortino Is Better

  • Asymmetric return distributions
  • Strategies with high upside but controlled drawdowns
  • Analyzing hedge funds or growth portfolios
  • Evaluating long-term investment safety

When Sharpe Might Still Work

  • Broad comparisons across traditional funds
  • When the return distribution is symmetrical
  • For quick risk-adjusted benchmarking

Bottom Line: Focus on the Risk You Actually Fear

Investors aren’t afraid of volatility — they’re afraid of losing money. The Sortino Ratio reflects that reality by isolating downside risk and offering a more practical view of performance.

If you’re still relying solely on the Sharpe Ratio to make your investment decisions, you’re only seeing half the picture.


📬 Want More Insights Like This?

Join thousands of investors who receive free trading alerts and deep investment insights delivered straight to their inbox.

👉 Subscribe to our newsletter for free and start investing smarter today.

You may also be interested in …

Why add Harmony Biosciences to your watchlist ?

Why add Harmony Biosciences to your watchlist ?

Harmony Biosciences ($HRMY) trades at a depressed valuation despite strong profitability and cash generation. The stock sold off on a recent Fragile X Phase 3 miss, but the core WAKIX franchise and new indications (e.g., PWS) keep revenues and margins robust (~75% GM, ~29% operating margin). Technically, $HRMY is oversold (RSI ~25) and sitting just above 52-week lows ($26.26), creating an asymmetric long setup if $25–26 support holds. Near-term resistance sits at $30–32; a base above $30 opens the path to $36–38 and potentially a re-rating toward consensus targets in the mid-40s. Key risks are pipeline execution and payer dynamics; upside drivers include continued cash flow strength, label expansion, and any positive pipeline or BD catalyst.

read more
Palantir Technologies (PLTR) Stock Analysis

Palantir Technologies (PLTR) Stock Analysis

Palantir Technologies ($PLTR) has rapidly evolved from a niche government contractor into one of the most closely watched names in artificial intelligence and big data. Known for its deep ties to U.S. defense and intelligence, the company is now expanding aggressively into commercial markets. With strong fundamentals, rising institutional adoption, and new AI-driven products like Palantir AIP, Palantir stands at the intersection of national security and next-gen enterprise solutions — making it one of the most strategic tech stocks to watch in 2025.

read more
Intel’s $5 Billion Lifeline from Nvidia—Will This AI Alliance Ignite a Historic Comeback or End in a Chip Meltdown?

Intel’s $5 Billion Lifeline from Nvidia—Will This AI Alliance Ignite a Historic Comeback or End in a Chip Meltdown?

Intel just shocked Wall Street with a 22% surge after Nvidia unveiled a $5 billion investment, igniting speculation of a massive AI-driven turnaround. This high-stakes alliance could reshape the semiconductor landscape and catapult INTC toward $50+ if momentum holds.

💡 Don’t trade blind—unlock expert price targets, stop-loss strategies, and real-time alerts to capitalize on this once-in-a-decade AI breakout.
👉 Get the next Intel trade setup now at BullishStockAlerts.com
before the next wave of profits leaves you behind!

read more
Trump’s $200 Billion UK Investment Shock—Will This Mega-Deal Supercharge British Markets or Fizzle Out?

Trump’s $200 Billion UK Investment Shock—Will This Mega-Deal Supercharge British Markets or Fizzle Out?

$200 billion of U.S. corporate money is flooding into Britain following President Trump’s high-profile visit—fueling a surge of excitement across UK markets. The FTSE 100 and British pound are flashing signals of a potential multi-month breakout as traders scramble to position ahead of detailed project announcements. Our expert analysis reveals short-, medium-, and long-term price targets so you can ride this capital wave before the next spike.

👉 Don’t wait for the headlines to fade—unlock real-time trade alerts and actionable price levels now at BullishStockAlerts.com
.

read more
Nikkei Pullback or Buying Opportunity? BOJ Holds Rates at 0.5% as Inflation Cools

Nikkei Pullback or Buying Opportunity? BOJ Holds Rates at 0.5% as Inflation Cools

Japan’s Nikkei 225 slipped after hitting fresh record highs as the Bank of Japan held rates at 0.5% and core inflation eased to 2.7%. With the yen strengthening and technical support near 44,000, this pullback could be the perfect buy-the-dip opportunity before the next rally. Our latest analysis reveals short-, medium-, and long-term targets on the Nikkei and USD/JPY, plus risk-managed trading strategies to seize the next move.

👉 Turn today’s volatility into tomorrow’s profits—get real-time trade alerts and actionable price levels now at BullishStockAlerts.com
.

read more

0 Comments

Submit a Comment

Your email address will not be published. Required fields are marked *

An abstract, dynamic depiction of a bullish market trend, characterized by sharp, angular shapes in shades of gold and brown, suggesting upward movement and growth.

Join our newsletter for exclusive, high-value portfolio tips!

Unlock the secrets to a thriving portfolio with our exclusive newsletter! Be the first to receive cutting-edge investment tips, expert analysis, and insider insights that will elevate your investment strategy. Don’t miss out on the opportunity to maximize your returns – subscribe now and transform your financial future!

Thank you for subscribing! You're now on your way to receiving the best investment tips and market insights directly to your inbox.