Introduction
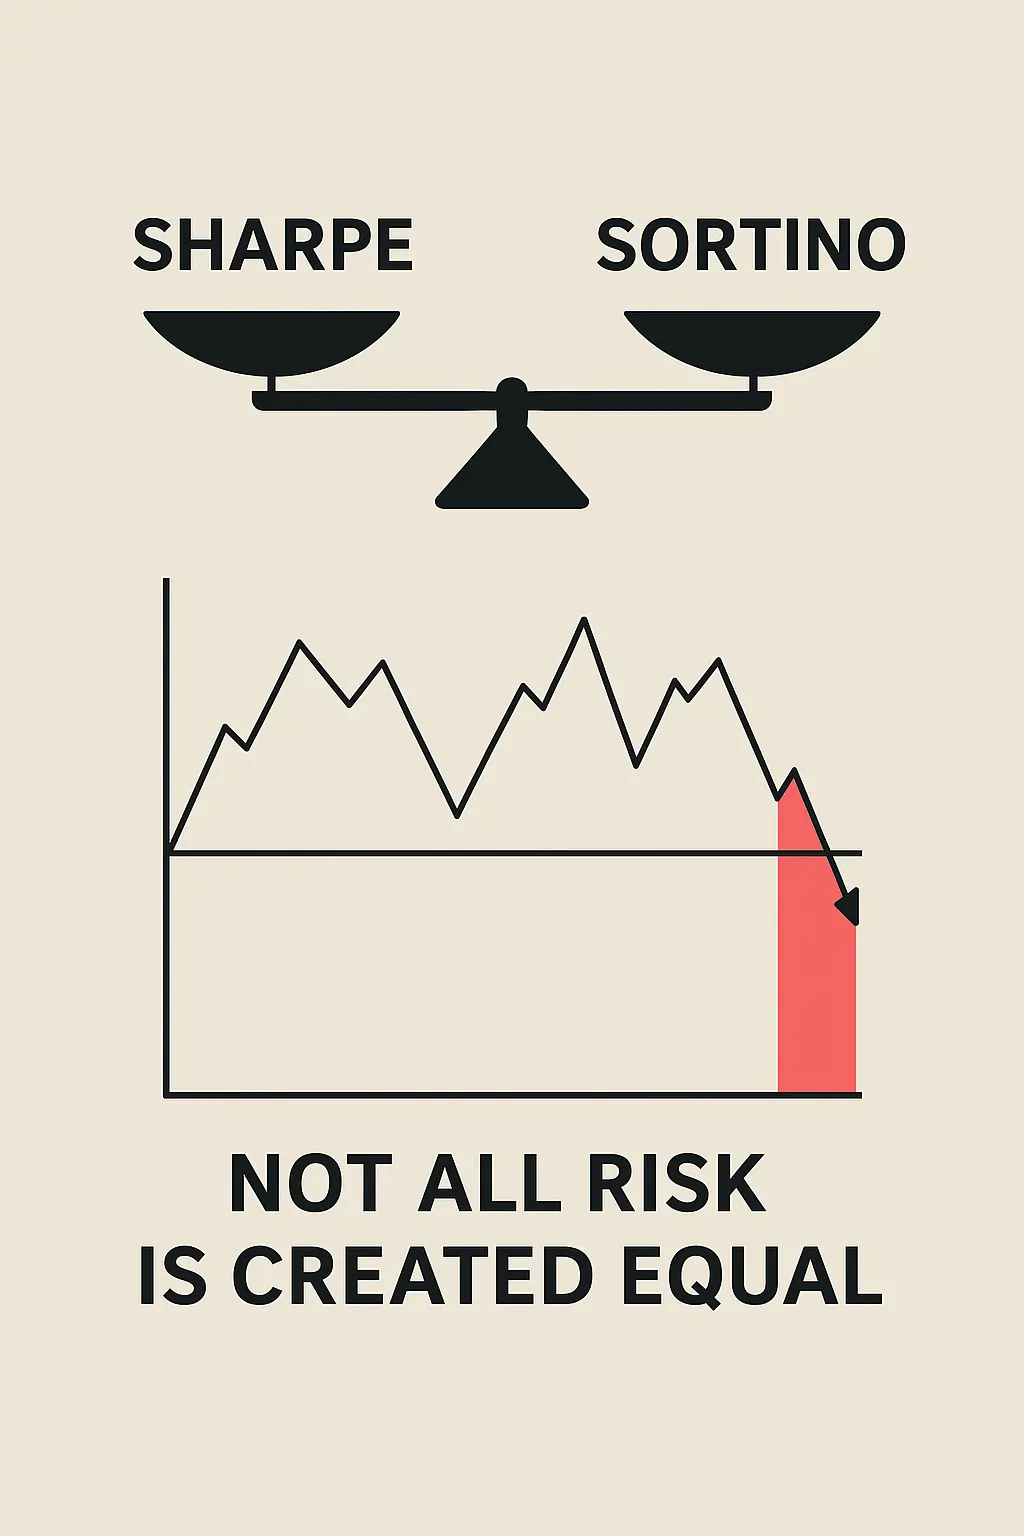
In the world of portfolio management and risk-adjusted returns, the Sharpe Ratio has long been a go-to metric. But is it truly the best way to measure investment performance? Enter the Sortino Ratio — a more nuanced, downside-focused version that many argue paints a clearer picture of risk.
In this article, we’ll explore the key differences between the Sharpe and Sortino ratios, explain how they work, and illustrate why focusing on downside risk may be more relevant for modern investors.
What Is the Sharpe Ratio?
Definition and Formula
The Sharpe Ratio measures the return of an investment compared to its total volatility. It’s calculated as:
Sharpe Ratio = (Rp - Rf) / σp
Where:
Rp= Portfolio returnRf= Risk-free rate (e.g., U.S. T-Bill)σp= Standard deviation of portfolio returns (total volatility)
Purpose
The Sharpe Ratio tells us how much excess return we get per unit of risk. The higher the ratio, the better the risk-adjusted performance.
Limitations of Sharpe
- Penalizes upside volatility the same way it penalizes downside volatility
- Doesn’t distinguish between “bad” and “good” risk
- Can be misleading in asymmetrical return distributions (e.g., hedge funds, options)
What Is the Sortino Ratio?
Definition and Formula
The Sortino Ratio is a variation of the Sharpe Ratio, but it only considers downside deviation — the part investors actually fear. Here’s the formula:
Sortino Ratio = (Rp - Rf) / σd
Where:
σd= Downside deviation (only standard deviation of negative returns below a defined threshold)
Why It Matters
Unlike the Sharpe Ratio, the Sortino Ratio doesn’t penalize positive volatility. It reflects a truer picture of risk, especially for portfolios that aim for asymmetric returns (e.g., growth funds or alpha-seeking strategies).
Real-World Example: Sharpe vs. Sortino in Action
Let’s compare two portfolios:
| Metric | Portfolio A | Portfolio B |
|---|---|---|
| Annual Return (%) | 12 | 12 |
| Risk-Free Rate (%) | 2 | 2 |
| Standard Deviation (%) | 10 | 10 |
| Downside Deviation (%) | 8 | 5 |
Sharpe Ratio for both = (12 – 2) / 10 = 1.0
Sortino Ratio A = (12 – 2) / 8 = 1.25
Sortino Ratio B = (12 – 2) / 5 = 2.0
Interpretation:
While both portfolios have the same Sharpe ratio, Portfolio B takes on less downside risk. The Sortino Ratio reveals this advantage clearly, making it more relevant for risk-sensitive investors.
When Should You Use Sortino Over Sharpe?
Situations Where Sortino Is Better
- Asymmetric return distributions
- Strategies with high upside but controlled drawdowns
- Analyzing hedge funds or growth portfolios
- Evaluating long-term investment safety
When Sharpe Might Still Work
- Broad comparisons across traditional funds
- When the return distribution is symmetrical
- For quick risk-adjusted benchmarking
Bottom Line: Focus on the Risk You Actually Fear
Investors aren’t afraid of volatility — they’re afraid of losing money. The Sortino Ratio reflects that reality by isolating downside risk and offering a more practical view of performance.
If you’re still relying solely on the Sharpe Ratio to make your investment decisions, you’re only seeing half the picture.
📬 Want More Insights Like This?
Join thousands of investors who receive free trading alerts and deep investment insights delivered straight to their inbox.
👉 Subscribe to our newsletter for free and start investing smarter today.


0 Comments