Introduction
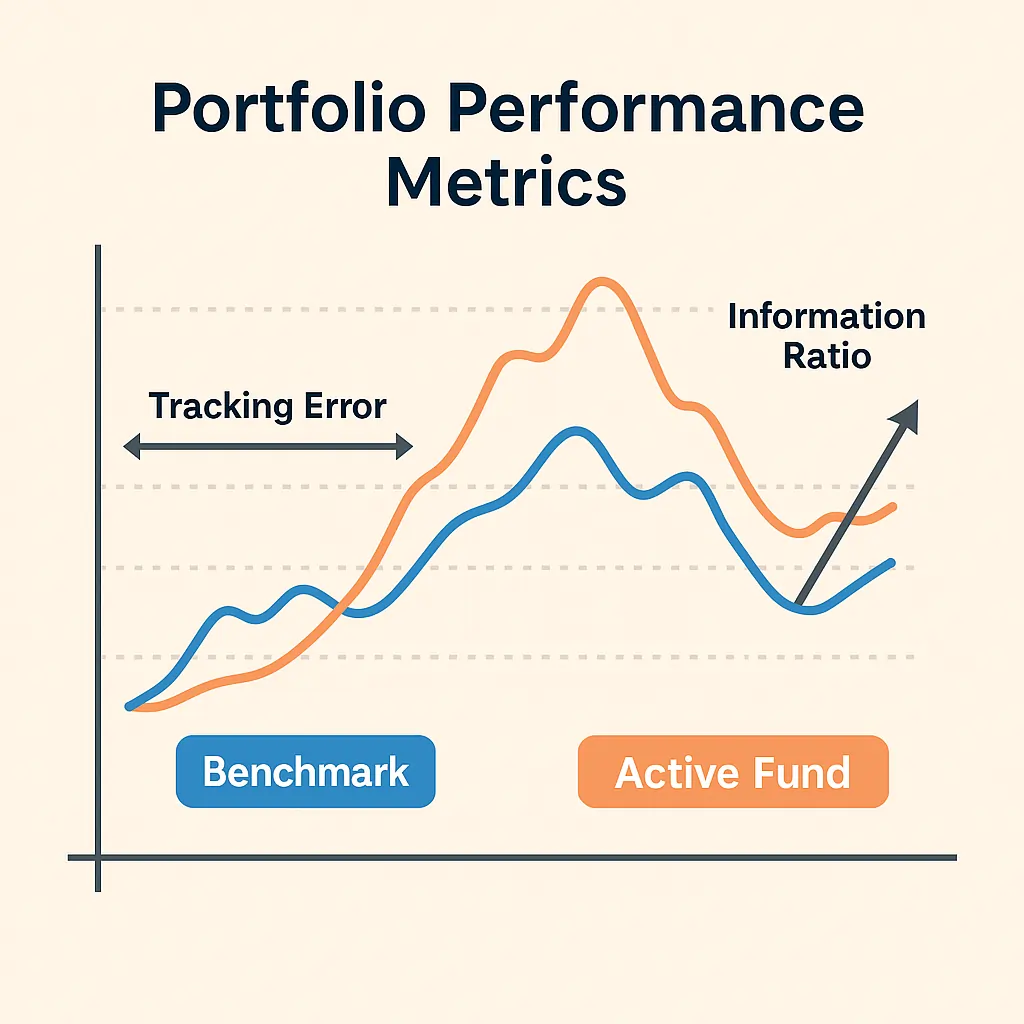
In the world of active investing, beating the market isn’t just about generating positive returns — it’s about outperforming a relevant benchmark consistently and efficiently. This is where two key performance metrics come into play: Tracking Error and Information Ratio. These tools help institutional and retail investors alike to measure how closely a portfolio follows its benchmark and whether the added risk is justified by superior returns.
In this article, we dive deep into how these metrics work, why they matter, and how you can apply them to improve your investment analysis.
What Is Tracking Error?
Definition
Tracking Error measures the standard deviation of the difference between a portfolio’s returns and its benchmark returns. It quantifies how much a portfolio ‘deviates’ from its benchmark.
Formula
Tracking Error = sqrt( (1 / (n – 1)) * Σ(Rp,i – Rb,i)^2 )
Interpreting Tracking Error
Low tracking error (≤1-2%) = Passive strategy or index-hugging.
High tracking error (≥5-6%) = Aggressive active management.
A tracking error of 0 means the portfolio perfectly mimics the benchmark.
Real Example
Imagine a mutual fund benchmarked against the S&P 500. Over a year:
– Fund return = 12.1%
– S&P 500 return = 11.0%
Monthly differences: 1.1%, 0.9%, 1.3%, etc.
If the result is 3%, this means the fund deviated from the benchmark by about 3% on average, monthly.
What Is the Information Ratio?
Definition
The Information Ratio (IR) evaluates the risk-adjusted excess return of a portfolio relative to its benchmark. It tells you how much excess return the manager generates per unit of active risk (i.e., Tracking Error).
Formula
Information Ratio = (Rp – Rb) / Tracking Error
Interpreting IR Values
IR > 1: Excellent risk-adjusted performance.
IR = 0.5 to 1: Good.
IR < 0.5: Weak or inefficient use of risk.
Real Example
Let’s continue the previous scenario:
Portfolio return = 12.1%
Benchmark return = 11.0%
Tracking Error = 3%
IR = (12.1 – 11.0) / 3 = 0.366
This is a modest Information Ratio, suggesting the portfolio did beat the benchmark, but not efficiently given the risk.
Why These Metrics Matter for Investors
Practical Use Cases
Fund Selection: Choose managers who consistently deliver high IRs.
Risk Monitoring: Avoid funds with high tracking errors and low IRs — high risk, low reward.
Performance Attribution: Understand whether active management is actually adding value.
Active vs. Passive Management
These metrics highlight the trade-off between trying to beat the market and staying close to it. A passive ETF will have near-zero tracking error and IR. An active fund must justify its fees by delivering an attractive IR.
Pro Tip: Track These Metrics Yourself
Use Excel, Python, or Power BI to calculate your Tracking Error and Information Ratio monthly or quarterly. Retail investors can use Morningstar, Portfolio Visualizer, or brokerage analytics tools.
Final Thoughts
Tracking Error and Information Ratio are essential indicators of manager skill, portfolio consistency, and value creation. Used together, they allow you to judge whether the risk you’re taking is paying off.
Want More Insights Like This?
Stay ahead of the markets and receive free, high-quality trading alerts and investment tips each week.
👉 Subscribe to Our Free Newsletter


0 Comments