Introduction
When financial markets grow turbulent, investors seek clarity on one crucial question: What is the worst-case scenario for my portfolio over the next few days or weeks? Value at Risk, or VaR, attempts to answer exactly that.
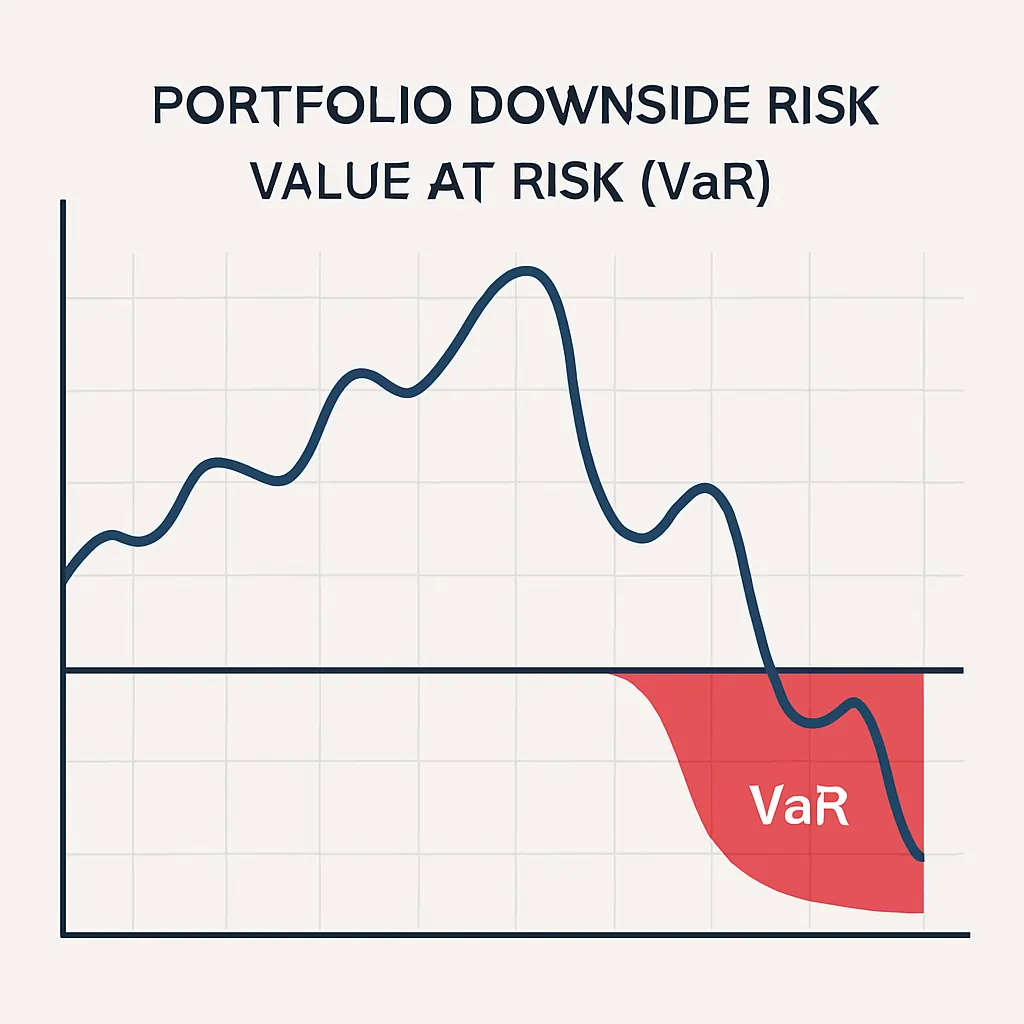
Value at Risk is one of the most widely used metrics in financial risk management. It estimates how much a portfolio could lose with a given probability over a specific time horizon. Banks, hedge funds, regulators, and professional investors rely on VaR to quantify and limit downside exposure.
In this article, we’ll break down the concept of VaR, examine how it’s calculated, and discuss its advantages, limitations, and use cases.
What Is Value at Risk (VaR)?
Value at Risk (VaR) is a statistical measure that indicates the maximum expected loss of a portfolio over a defined time period, at a specific confidence level. In simple terms:
“There is a 95% chance that the portfolio will not lose more than $X over the next N days.”
The Three Key Elements of VaR:
1. Time horizon (e.g., 1 day, 10 days)
2. Confidence level (e.g., 95%, 99%)
3. Estimated potential loss (in monetary or percentage terms)
Methods of Calculating VaR
There are three main approaches to calculating VaR:
1. Historical Simulation:
Uses actual past returns to estimate future losses.
– No assumption of distribution
– Simple to implement
– Requires large and clean datasets
2. Variance-Covariance Method (Parametric VaR):
Assumes returns are normally distributed.
– Uses mean and standard deviation
– Quick to compute
– May underestimate risk in extreme markets
Formula:
VaR = Z × σ × √t
Where:
– Z = Z-score (1.65 for 95%, 2.33 for 99%)
– σ = standard deviation of returns
– t = time horizon
3. Monte Carlo Simulation:
Generates thousands of random price paths based on statistical inputs.
– Very flexible
– Computationally intensive
– Used in complex portfolios (derivatives, multi-asset)
Example: VaR in Action
Let’s say you manage a portfolio worth $1,000,000 with a daily volatility of 2%. You want to know the 1-day VaR at a 95% confidence level.
Using the Variance-Covariance Method:
– Z = 1.65 (for 95%)
– σ = 0.02
VaR = 1.65 × 0.02 × 1 = 0.033 = 3.3%
This means:
There is a 95% chance the portfolio will not lose more than $33,000 in one day.
Why VaR Matters for Investors
1. Risk Visibility:
VaR offers a clear snapshot of downside exposure, essential for risk-adjusted decision-making.
2. Regulatory Requirement:
Under Basel III and Solvency II, financial institutions must report and manage VaR.
3. Position Sizing & Stop-Loss Management:
Helps determine how much capital to allocate or hedge, based on potential drawdowns.
4. Portfolio Comparison:
Useful for comparing risk across different assets, funds, or strategies.
Limitations of VaR
– Does not capture tail risk beyond the confidence level (e.g., Black Swan events)
– Assumes normality in some methods
– Can be manipulated through short data windows or selective modeling
Complementary Metrics: CVaR (Conditional Value at Risk), Maximum Drawdown, Stress Testing
Conclusion
Value at Risk is a cornerstone of modern portfolio risk management. While it isn’t perfect, it provides a clear, quantifiable estimate of potential losses. Used alongside other tools like CVaR and stress tests, it empowers investors to make informed decisions during uncertain times.
Free Newsletter CTA
Get exclusive trading alerts, investment tips, and in-depth financial insights by joining our free newsletter.
Stay ahead of the market. Manage risk intelligently. Be part of the bullish side.
Discover More
For more insights into analyzing value and growth stocks poised for sustainable growth, consider this expert guide. It provides valuable strategies for identifying high-potential value and growth stocks.
We also have other highly attractive stocks in our portfolios. To explore these opportunities, visit our investment portfolios.
This analysis serves as information only and should not be interpreted as investment advice. Conduct your own research or consult with a financial advisor before making investment decisions.
Looking to Educate Yourself for More Investment Strategies?
Check out our free articles where we share our top investment strategies. They are worth their weight in gold!
📖 Read them on our blog: Investment Blog
For deeper insights into ETF investing, trading, and market strategies, explore our library or go to Lulu.com for each guide:
📘 ETF Investing: ETFs and Financial Serenity
📘 Technical Trading: The Art of Technical & Algorithmic Trading
📘 Stock Market Investing: Unearthing Gems in the Stock Market
📘 Biotech Stocks (High Risk, High Reward): Biotech Boom






0 Comments