Introduction – Why Market Exposure Matters
Every investor wants higher returns, but few understand the underlying risks they’re exposed to. Two key metrics that help you evaluate your portfolio’s sensitivity to the market are Beta and Volatility. These are directly tied to systematic risk — the risk inherent to the entire market that cannot be diversified away.
In this article, we’ll demystify these concepts, show you how to calculate and interpret them, and explain how they impact your long-term investment strategy.
What is Systematic Risk?
Systematic risk (also called market risk) refers to the portion of total risk that is common to all securities in the market. It arises from macroeconomic factors like interest rate changes, inflation, geopolitical tensions, or recessions. Unlike unsystematic risk (which can be reduced by diversification), systematic risk cannot be eliminated.
Examples of systematic risk:
- Central bank interest rate decisions
- Global pandemics
- Political instability
- Market-wide crashes
This is the risk that beta and volatility aim to capture and quantify.
What is Beta? (Definition & Interpretation)
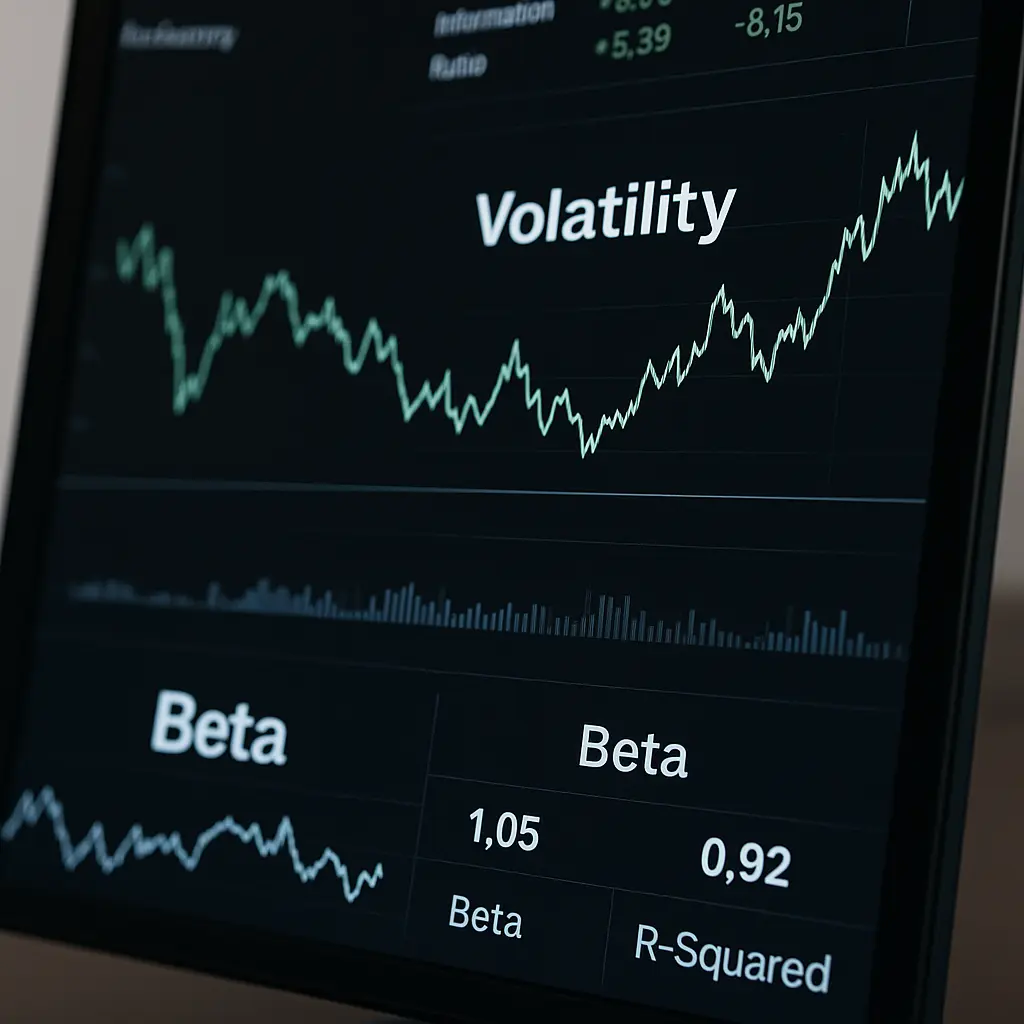
Beta is a measure of a security’s sensitivity to movements in the overall market. It tells you how much your asset or portfolio will move in response to market fluctuations.
Beta formula:
Beta = Covariance(asset, market) / Variance(market)Interpretation:
- Beta = 1: Moves in line with the market
- Beta > 1: More volatile than the market (amplified exposure)
- Beta < 1: Less volatile than the market
- Beta < 0: Moves inversely (e.g., gold, inverse ETFs)
Real-world example:
If a stock has a beta of 1.5, and the market rises by 10%, the stock is expected to rise by 15%. Conversely, if the market drops by 10%, the stock might fall by 15%.
What is Volatility?
Volatility measures the degree of variation of returns over time. Unlike beta (which compares to the market), volatility is absolute — it reflects how unpredictable an asset’s returns are.
Volatility formula:
Volatility = Standard deviation of returnsVolatility helps investors understand:
- How “risky” an asset is on its own
- How wide the range of possible returns can be
- The likelihood of extreme drawdowns
Example:
If Asset A has a volatility of 5% and Asset B has 20%, Asset B has a much wider range of expected outcomes — both higher gains and bigger losses.
Beta vs Volatility – Key Differences
| Feature | Beta | Volatility |
|---|---|---|
| Type | Relative to the market | Absolute |
| Measures | Market sensitivity | Total return dispersion |
| Use Case | Asset allocation, market timing | Risk control, options pricing |
| Market Context | Requires market benchmark | Independent of market movement |
Using Beta and Volatility in Portfolio Management
Smart investors and portfolio managers use both beta and volatility to:
- Construct diversified portfolios
- Optimize risk-adjusted returns
- Adjust exposure based on market regimes
- Perform stress-testing and scenario analysis
Beta-Based Strategy Example:
If you expect a bull market, you might tilt your portfolio toward high-beta stocks (e.g., beta > 1.2). If you anticipate a correction, reducing beta exposure limits drawdowns.
Volatility-Based Strategy Example:
During periods of high market uncertainty, reducing exposure to highly volatile assets helps stabilize returns.
Limitations of Beta and Volatility
- Beta assumes linearity — it may not work well for non-linear assets (options, structured products).
- Volatility doesn’t differentiate upside/downside — it penalizes both.
- Both are backward-looking, based on historical data.
Combining these with other risk-adjusted metrics (e.g., Sharpe ratio, Sortino, VaR) yields a more complete picture.
Final Thoughts – Make Better Decisions with the Right Metrics
Understanding your portfolio’s exposure to market movements is essential. Beta and volatility, when used together, help quantify both how much risk you’re taking and how that risk behaves.
For serious investors, these tools are foundational — whether you’re building a retirement portfolio or managing institutional assets.
📬 Stay Ahead with Our Free Newsletter
If you enjoyed this breakdown, subscribe to our free newsletter. You’ll receive:
- Real-time trading alerts
- Market risk updates
- Expert investment insights
Take control of your investments with data that works for you.
Looking to Educate Yourself for More Investment Strategies?
Check out our free articles where we share our top investment strategies. They are worth their weight in gold!
📖 Read them on our blog: Investment Blog
For deeper insights into ETF investing, trading, and market strategies, explore our library or go to Lulu.com for each guide:
📘 ETF Investing: ETFs and Financial Serenity
📘 Technical Trading: The Art of Technical & Algorithmic Trading
📘 Stock Market Investing: Unearthing Gems in the Stock Market
📘 Biotech Stocks (High Risk, High Reward): Biotech Boom


0 Comments