
Micron Technology (MU) is not a traditional memory manufacturer: it is a strategic semiconductor company positioned in DRAM, NAND, and high-value solutions used in data centers and artificial intelligence.
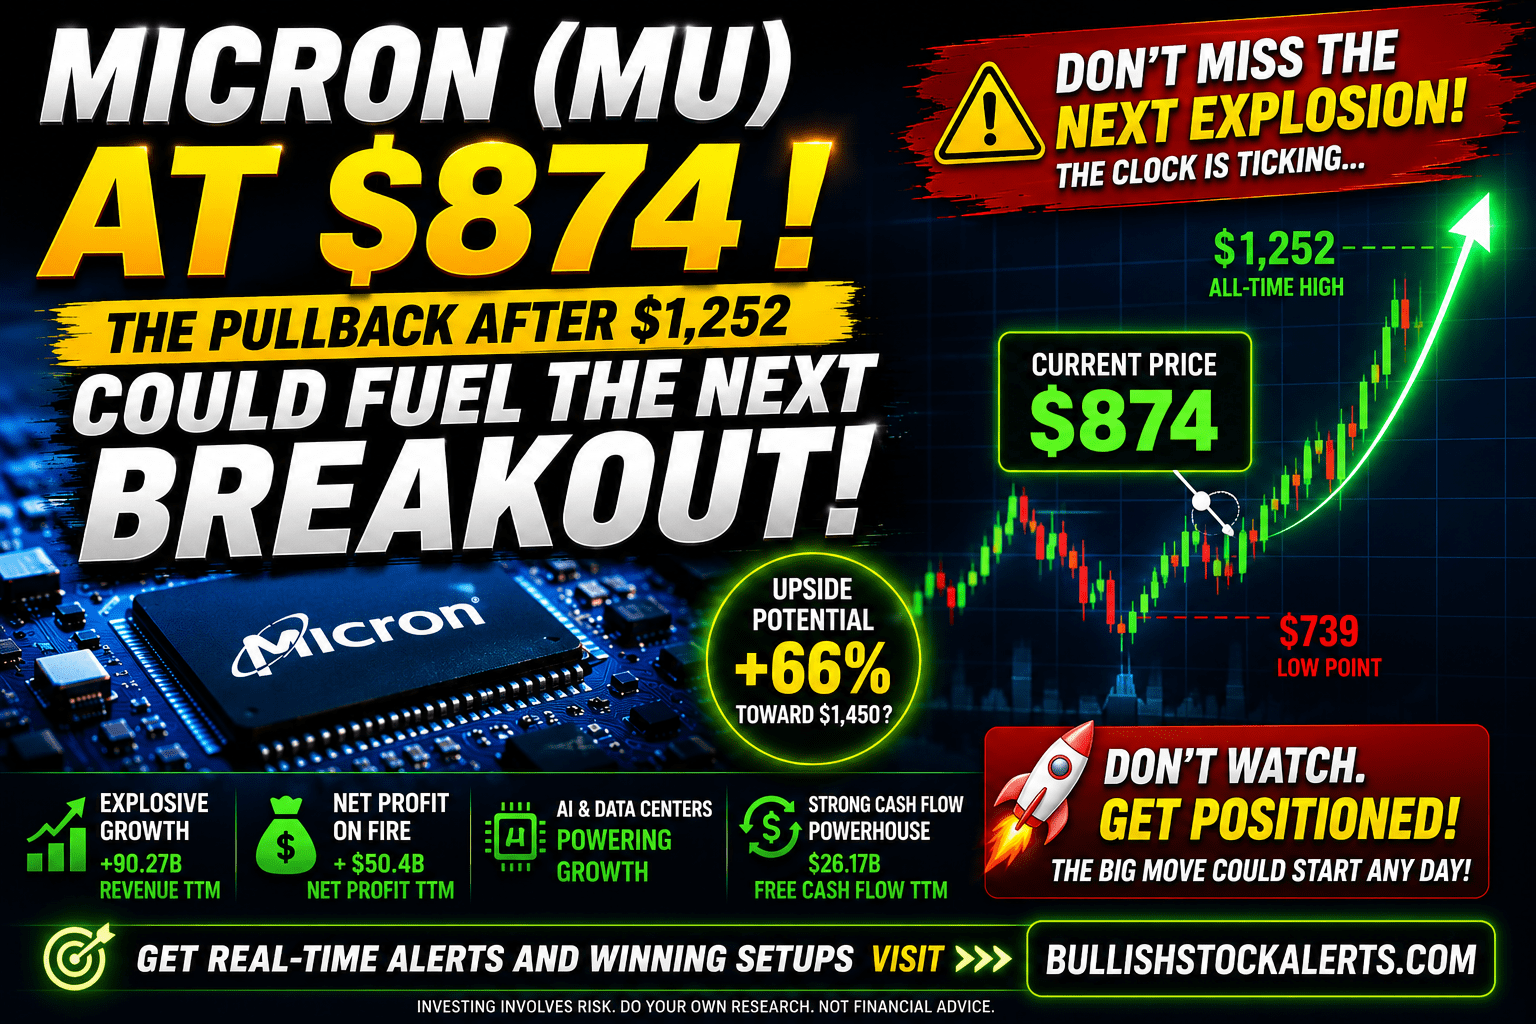
After reaching a high of $1,252, the stock corrected to $739, before rebounding toward $874. This decline represents a retracement of approximately 41% from the high to the low. The overall trend remains bullish, but the stock remains highly volatile and strongly dependent on the memory cycle.
1. Consolidated Financial Performance
| Key indicator | TTM | FY 2025 | FY 2024 | Trend |
|---|---|---|---|---|
| Total revenue | $90,274M | $37,378M | $25,111M | Spectacular growth |
| EBITDA | $68,364M | $18,362M | $9,006M | Strong acceleration |
| Net income | $50,469M | $8,539M | $778M | Explosion in profitability |
| Diluted EPS | $44.17 | $7.59 | $0.70 | Exceptional increase |
| Gross margin | 72.60% | 40.17% | 23.04% | Strong expansion |
| Operating margin | 65.75% | 26.78% | 4.88% | Remarkable recovery |
| Shares outstanding | 1,129M | 1,122M | 1,109M | Slight increase |
| Free cash flow | $26,172M | $1,668M | $121M | Massive improvement |
Key comments
Micron is showing an impressive financial acceleration. TTM revenue reached $90.27 billion, while net income exceeded $50 billion, according to the figures provided.
The improvement is particularly striking compared with 2024, when net income amounted to only $778 million. The recovery in the memory cycle, stronger selling prices, and AI-related demand have significantly supported the company’s results. Micron’s FY 2025 results had already confirmed annual revenue growth toward $37.4 billion and a significant expansion in margins.
Key takeaway: MU benefits from powerful operating leverage. When memory prices rise, revenue can increase rapidly while a significant portion of costs remains relatively fixed. This can trigger a sharp rise in earnings — but also a rapid contraction when the cycle turns.
2. Margins: A Spectacular Recovery
| Margin | TTM | FY 2025 | FY 2024 | Interpretation |
|---|---|---|---|---|
| Gross margin | 72.60% | 40.17% | 23.04% | Exceptional expansion |
| Operating margin | 65.75% | 26.78% | 4.88% | Very strong improvement |
| Net margin | 55.91% | 22.84% | 3.10% | Extremely high level |
The expansion in margins is one of the most impressive aspects of this analysis. A TTM net margin of 55.91% places Micron at an exceptional level of profitability, although this figure should be interpreted cautiously given the cyclical nature of the industry.
Micron does not necessarily have the same structural stability as a company such as Mastercard or a software publisher. Its margins can rise sharply during periods of supply shortages or strong demand, then contract when the market becomes oversupplied.
Demand for high-performance memory, particularly for AI infrastructure, is an important catalyst. Micron has highlighted the growth of its data center and AI-related activities in its financial communications.
3. Cash Flow and Capital Allocation
| Cash flow item | TTM | FY 2025 | FY 2024 | Strategic interpretation |
|---|---|---|---|---|
| Cash from operations | $51,432M | $17,525M | $8,507M | Strong improvement |
| CapEx | -$25,260M | -$15,857M | -$8,386M | Heavy investment |
| Free cash flow | $26,172M | $1,668M | $121M | Spectacular rebound |
| Dividends | -$567M | -$522M | -$513M | Moderate |
| Share buybacks | -$1,412M | $0M | -$300M | Limited |
| Net debt reduction | -$10,395M | -$189M | -$898M | Significant deleveraging |
| Cash from financing | -$11,710M | -$850M | -$1,842M | Controlled outflows |
Micron is now generating substantial free cash flow, but its business requires much higher capital expenditures than Mastercard or Meta. TTM CapEx of $25.26 billion reflects the need to expand production capacity and remain competitive in advanced memory technologies.
The positive point is that operating cash flow comfortably exceeds investment spending. Free cash flow therefore reached $26.17 billion, compared with only $121 million in FY 2024.
The net debt reduction of more than $10 billion is also a favorable signal for the balance sheet. However, capital allocation is less focused on share buybacks than at NVIDIA or Meta because Micron must finance its industrial expansion.
4. Valuation and Price Analysis
| Ratio | Value | Interpretation |
|---|---|---|
| P/E ratio, TTM | 19.87x | Moderate on the surface |
| Price / Sales | 11.71x | High |
| Price / Free Cash Flow | 41.30x | Demanding |
| Market capitalization | $991B | Very large capitalization |
At $874, Micron has a P/E ratio of approximately 19.87x, which may appear reasonable given the growth in earnings. However, the price-to-sales ratio of 11.71x and the price-to-free-cash-flow ratio of 41.30x show that the market is already pricing in continued growth and elevated margins.
The main risk is that current earnings may be close to a cyclical peak. In that case, a P/E ratio calculated on TTM earnings could make the stock appear inexpensive, even though future results may slow.
Conversely, if demand for HBM, DRAM, and data center memory continues to grow, future earnings could increase enough to make the current valuation more acceptable. Some analysts specifically highlight Micron’s role in the AI-related memory cycle.
5. Stock Price Scenarios
| Horizon | Target | Scenario | Potential from $874 |
|---|---|---|---|
| Short term | $800–$850 | Further consolidation | -8% to -3% |
| Base case | $950–$1,050 | Gradual recovery | +9% to +20% |
| Return to high | $1,252 | Full recovery | +43% |
| Bullish breakout | $1,300–$1,450 | New highs | +49% to +66% |
The current price of $874 is approximately 18% above the low of $739, but still nearly 30% below the high of $1,252. This setup leaves open the possibility of a rebound, but the stock must first confirm that the support area around $739–$800 is holding on a sustained basis.
A move back above $950–$1,000 would improve the technical structure and could attract new buyers. A break above $1,252 would represent the key breakout signal toward new highs.
External estimates available around the period under review were more cautious in the short term, with some targets near $910, while still maintaining significantly higher bullish scenarios if the AI cycle continues.
6. Key Risks
- Cyclicality of the memory market: DRAM and NAND prices can fluctuate significantly.
- Demanding valuation: The price-to-free-cash-flow ratio remains high despite a relatively moderate P/E ratio.
- Heavy CapEx: Micron must invest heavily to expand its production capacity.
- Risk of oversupply: Excess capacity could put pressure on prices and margins.
- Dependence on AI: A reduction in spending by major technology customers could slow demand.
- High volatility: MU’s beta was close to 1.90 in the available market data, highlighting volatility significantly above that of the broader market.
- Competition: Samsung and SK Hynix remain major competitors in the memory and HBM markets.
7. Conclusion and Recommendation
| Factor | Assessment |
|---|---|
| Business quality | Very strong, but cyclical |
| Strategic position | Important in AI and data centers |
| Margins | Currently exceptional |
| Cash generation | Improving sharply |
| Capital allocation | Prudent and investment-focused |
| Profile | Cyclical growth compounder |
Verdict: BUY ON PULLBACK / HOLD
At $874, Micron remains a strategic company with strong exposure to artificial intelligence growth. The increase in revenue, the surge in earnings, and the recovery in free cash flow are highly impressive.
However, MU must be analyzed differently from NVIDIA or Meta. It is a more cyclical company whose margins can change rapidly depending on the balance between memory supply and demand.
The $739–$800 area may represent a zone to monitor and potentially accumulate gradually for investors who can tolerate high volatility. Above $950–$1,000, the stock could regain a more clearly bullish dynamic. A break above $1,252 would be the major technical signal confirming a potential move toward new highs.
MU therefore remains interesting on a pullback, but discipline regarding the entry price is essential. Historical data also shows that the company can experience substantial changes in profitability from one fiscal year to the next, which justifies a cautious approach despite the excellent TTM figures.
Disclaimer :
This content is for informational purposes only and does not constitute investment advice. All investments carry risk, including the loss of capital. Conduct your own research before making any decision.
Looking to Educate Yourself for More Investment Strategies?
Check out our free articles where we share our top investment strategies. They are worth their weight in gold!
Read them on our blog: Investment Blog
For deeper insights into ETF investing, trading, and market strategies, explore these expert guides:
📘ETFs and Financial Serenity
📘The Art of Technical & Algorithmic Trading
📘Unearthing Gems in the Stock Market
📘Biotech Boom
📘Cryptocurrency & Blockchain Revolution
Did you find this article insightful? Subscribe to the Bullish Stock Alerts newsletter so you never miss an update and gain access to exclusive stock market insights. https://bullishstockalerts.com




0 Comments