Jensen’s Alpha: Measuring Skill Beyond Market Return

by | Jun 1, 2025 | Investing Tools and Regulations | 0 comments

Introduction: Why Measuring Skill Matters

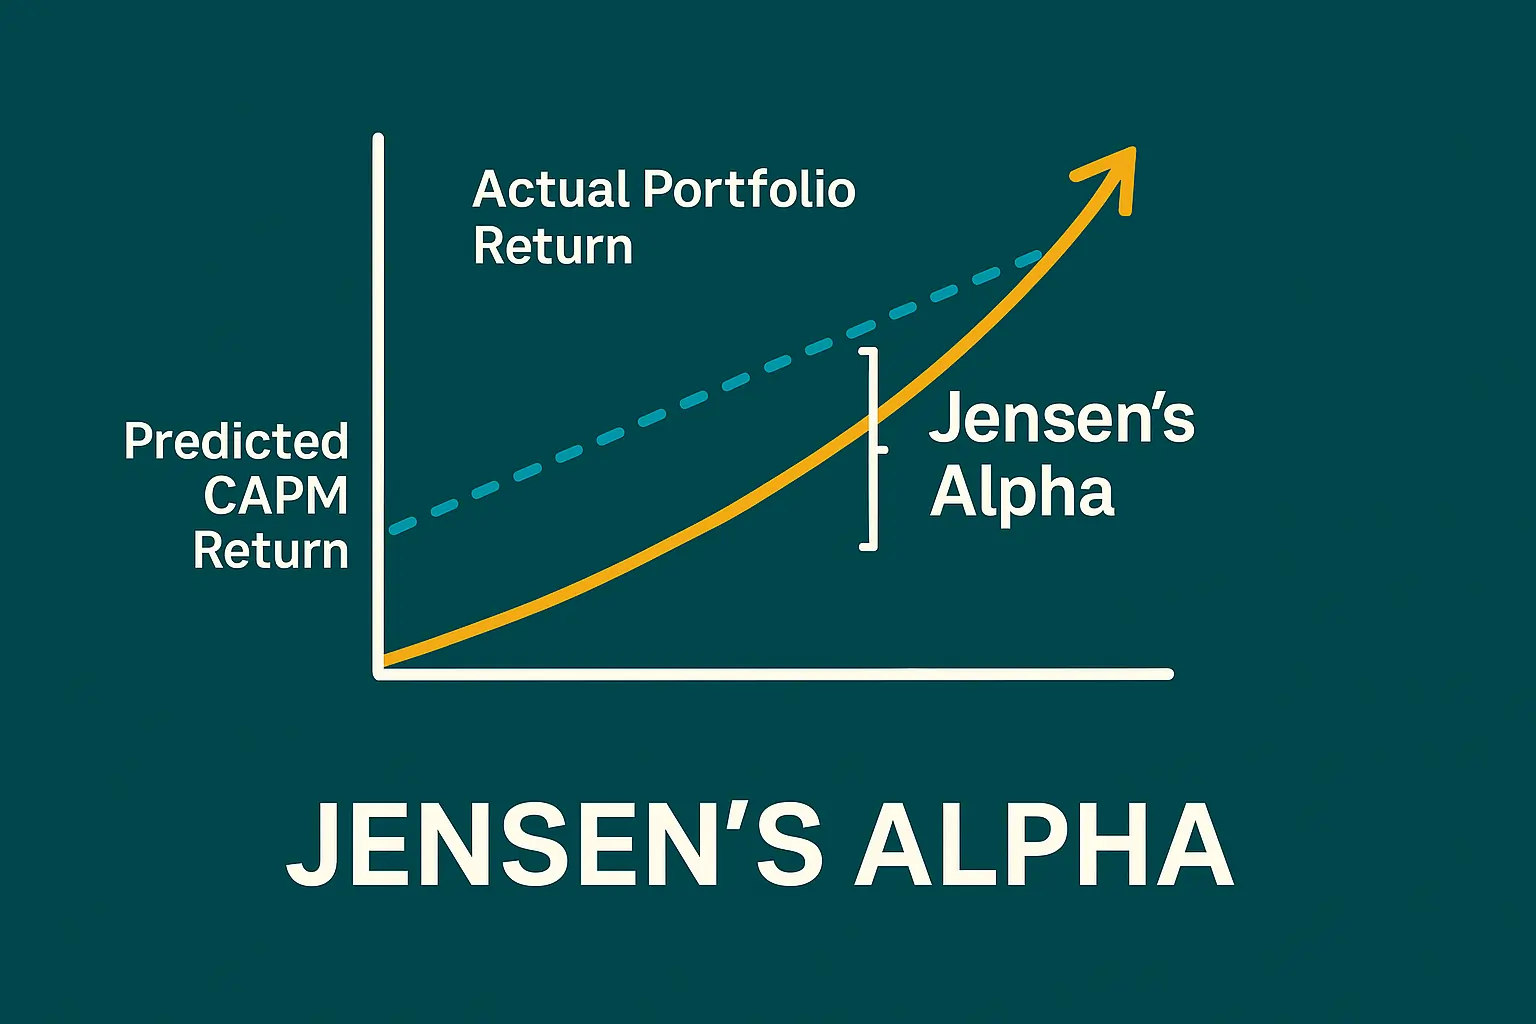
In a world where beating the market is the holy grail of investing, how do you determine whether a fund manager is truly skilled—or just lucky? That’s where Jensen’s Alpha comes in. This powerful metric evaluates the risk-adjusted performance of a portfolio compared to what it should have earned, based on market movements alone. It helps investors identify true value creators among the noise.


What Is Jensen’s Alpha?

Jensen’s Alpha is a performance indicator developed by Michael Jensen in 1968. It measures the excess return a portfolio generates over the return predicted by the Capital Asset Pricing Model (CAPM). In other words, it tells you if a portfolio manager has outperformed or underperformed, after adjusting for market risk (beta).

Formula: α = Rp – [Rf + β(Rm – Rf)]

Where:

  • : Jensen’s Alpha
  • : Portfolio return
  • : Risk-free rate (e.g., 10-year government bond)
  • : Market return (e.g., S&P 500)
  • : Portfolio’s beta (sensitivity to market movements)

Interpreting Jensen’s Alpha

  • : The portfolio outperformed its risk-adjusted benchmark – sign of potential skill.
  • : Performance is in line with market-adjusted expectations.
  • : The portfolio underperformed – possible inefficiency or poor management.

Unlike raw return, Jensen’s Alpha separates market movement from manager skill. This is critical for evaluating actively managed funds, hedge funds, and even robo-advisors.


Example: Jensen’s Alpha in Action

Suppose:

  • Portfolio return () = 12%
  • Market return () = 10%
  • Risk-free rate () = 2%
  • Portfolio beta () = 1.1

Step-by-Step Calculation: Assume the following:

• Rp = 12%

• Rm = 10%

• Rf = 2%

• β = 1.1

Step 1: Calculate the expected return using CAPM.

Expected return = Rf + β(Rm – Rf)

= 2% + 1.1 × (10% – 2%)

= 2% + 8.8% = 10.8%

Step 2: Subtract the expected return from the actual portfolio return.

Jensen’s Alpha = Rp – Expected return

= 12% – 10.8% = 1.2%

Interpretation: The portfolio outperformed the market-adjusted return by 1.2%. This suggests that the manager added value beyond market exposure.

The portfolio generated 1.2% more than what CAPM would have predicted, indicating positive alpha and likely skill.


How Investors Can Use It

  • Fund Selection: Choose mutual funds, ETFs, or hedge funds that consistently show positive alpha.
  • Performance Attribution: Distinguish between luck and true management skill.
  • Risk Management: Pair Jensen’s Alpha with Sharpe Ratio and Beta to get a full picture of performance.

Caution: Alpha can be distorted by short-term anomalies, leverage, or benchmark misalignment. It works best when applied over long periods with consistent benchmarks.


Tools That Provide Jensen’s Alpha

  • Morningstar: Shows alpha over 3, 5, and 10 years
  • Portfolio Visualizer: DIY backtests
  • Bloomberg Terminal: For institutional investors
  • Our Newsletter: We integrate Jensen’s Alpha in our portfolio evaluations – Join here for free!

Conclusion: Alpha Is the Signal, Not the Noise

In a sea of returns, Jensen’s Alpha acts like a lighthouse—highlighting managers and portfolios that truly outperform. By adjusting for market risk, it provides a fair and powerful lens to assess performance. For any serious investor, learning to interpret alpha isn’t just useful—it’s essential.

📥 Want curated insights and outperforming stock alerts? Join our free newsletter and receive trading alerts backed by data, not noise.

Discover More

For more insights into analyzing value and growth stocks poised for sustainable growth, consider this expert guide. It provides valuable strategies for identifying high-potential value and growth stocks.

We also have other highly attractive stocks in our portfolios. To explore these opportunities, visit our investment portfolios.

This analysis serves as information only and should not be interpreted as investment advice. Conduct your own research or consult with a financial advisor before making investment decisions.

Looking to Educate Yourself for More Investment Strategies?

Check out our free articles where we share our top investment strategies. They are worth their weight in gold!


📖 Read them on our blog: Investment Blog

For deeper insights into ETF investing, trading, and market strategies, explore our library or go to Lulu.com for each guide:

📘 ETF InvestingETFs and Financial Serenity
📘 Technical TradingThe Art of Technical & Algorithmic Trading
📘 Stock Market InvestingUnearthing Gems in the Stock Market
📘 Biotech Stocks (High Risk, High Reward)Biotech Boom

You may also be interested in …

The Second Half Surge: Why Volatility Could Be the Opportunity of the Year

The Second Half Surge: Why Volatility Could Be the Opportunity of the Year

Markets are entering a make-or-break phase. After a wild first half of 2025 filled with black swan events, tariff twists, and political showdowns, the second half promises even more explosive moves. With the ECB Forum in Sintra and U.S. Fed tensions heating up, investors are bracing for central bank shocks, rising volatility, and sudden trend reversals.

Goldman Sachs is sounding the alarm: brace for elevated policy risks and extreme equity swings. Yet amid this chaos, some indices—like Germany’s DAX—are quietly outperforming, hinting at deeper shifts beneath the surface.

The question is: Will you ride the next wave or miss the breakout entirely?
Don’t trade blind. Join the movement of forward-thinking investors who turn uncertainty into opportunity.

👉 Unlock market insights and premium alerts now at bullishstockalerts.com

read more
The BP Takeover Buzz: A Once-in-a-Decade Opportunity Investors Can’t Ignore

The BP Takeover Buzz: A Once-in-a-Decade Opportunity Investors Can’t Ignore

“Is BP the Next Big Acquisition? Or Just Severely Undervalued?”
While Shell denies talks of a takeover, investors can’t ignore the rising smoke. With BP’s shares down 15% since its strategic pivot—and heavyweight players like Exxon, Chevron, and even Adnoc circling—this might be the most misunderstood value play in the energy sector today.

The company’s transition from renewables back to fossil fuels under its new CEO may have rattled ESG investors, but for value-focused and contrarian traders, the timing couldn’t be juicier. Combine that with a discounted valuation, potential activist pressure from Elliott, and geopolitical tailwinds from energy demand—this is shaping up to be a high-risk, high-reward setup.

📈 We’ve mapped out the technical zones, catalysts, and targets—both short and long term. If you’re a serious investor who knows that fear often hides opportunity…

👉 Dive deeper into the analysis now at bullishstockalerts.com

read more
Why This Summer Could Be the Turning Point for Your Portfolio

Why This Summer Could Be the Turning Point for Your Portfolio

Is your portfolio ready for the next market breakout?
With European indices surging and U.S. rate cuts looming, now is the perfect moment to act before the crowd does. As macroeconomic clouds start to clear, savvy investors are positioning themselves ahead of the wave—identifying high-conviction plays across tech, defense, and energy.

At Bullish Stock Alerts, we don’t just follow the news—we decode it. Our latest analysis uncovers stocks with explosive upside, technical momentum, and resilient fundamentals. Whether you’re a swing trader or long-term investor, our tiered target prices and stop-loss strategies give you the edge you need in volatile markets.

Your next big move could start today.
👉 Explore high-potential stocks now at bullishstockalerts.com — your go-to source for premium market insights.

read more
🌍 US–Canada Trade Truce Ignites Global Rally — Don’t Miss the Next Big Move!

🌍 US–Canada Trade Truce Ignites Global Rally — Don’t Miss the Next Big Move!

Markets are on fire as the US and Canada revive trade talks, lifting global investor sentiment. While Wall Street eyes potential Fed rate cuts, the real money is already moving—into select equities, forex, and commodities set to benefit from this macro reset.

From the falling dollar to a shaky labor market, and gold hovering below its highs, we break down what it all means—and where the smartest capital is going next.

This isn’t just noise. This is a window of opportunity.

Get insider insights, technical setups, and clear price targets across multiple timeframes—all crafted to help you ride the next big wave.

🚨 The market is shifting. Are you positioned right?
👉 Visit bullishstockalerts.com to unlock the edge.

read more

0 Comments

Submit a Comment

Your email address will not be published. Required fields are marked *

An abstract, dynamic depiction of a bullish market trend, characterized by sharp, angular shapes in shades of gold and brown, suggesting upward movement and growth.

Join our newsletter for exclusive, high-value portfolio tips!

Unlock the secrets to a thriving portfolio with our exclusive newsletter! Be the first to receive cutting-edge investment tips, expert analysis, and insider insights that will elevate your investment strategy. Don’t miss out on the opportunity to maximize your returns – subscribe now and transform your financial future!

Thank you for subscribing! You're now on your way to receiving the best investment tips and market insights directly to your inbox.