Tracking Error & Information Ratio: Benchmarking Performance Accurately

by | Jun 1, 2025 | Investing Tools and Regulations | 0 comments

Introduction

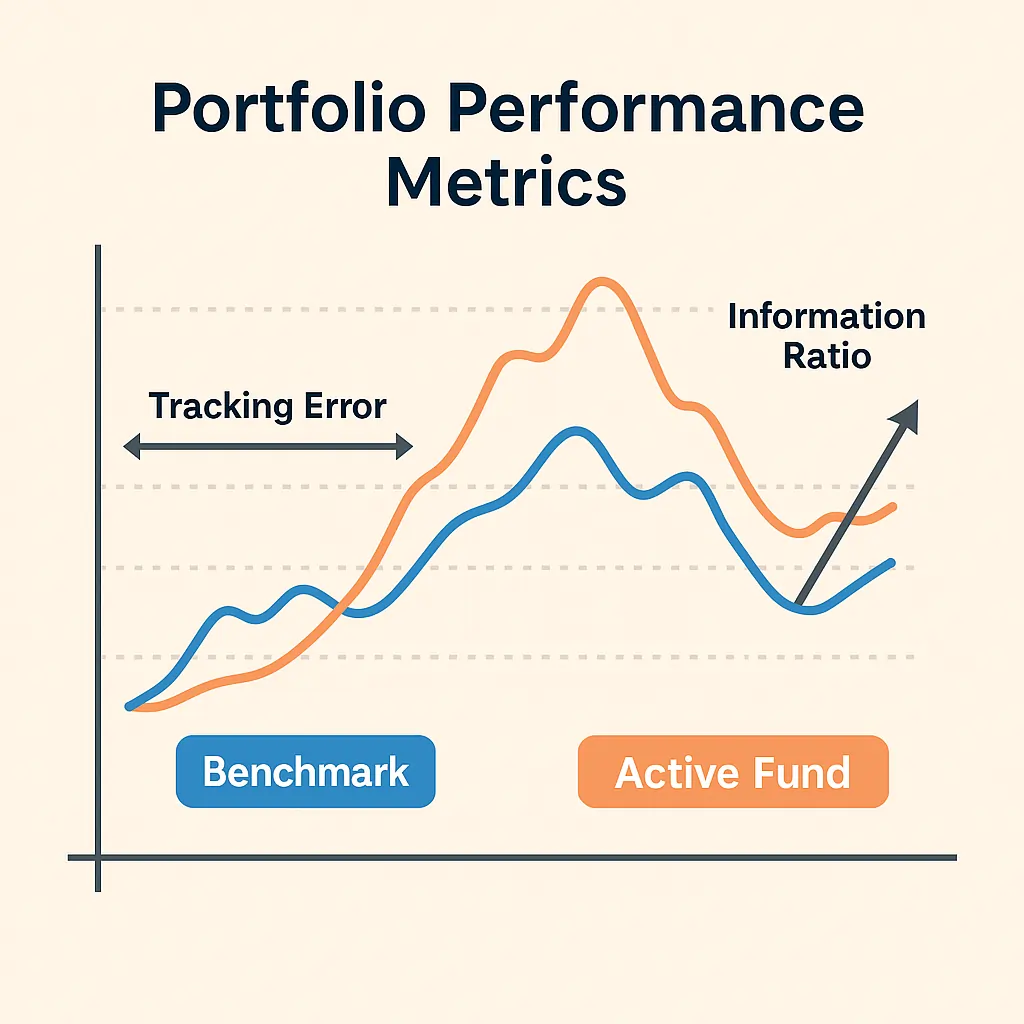
In the world of active investing, beating the market isn’t just about generating positive returns — it’s about outperforming a relevant benchmark consistently and efficiently. This is where two key performance metrics come into play: Tracking Error and Information Ratio. These tools help institutional and retail investors alike to measure how closely a portfolio follows its benchmark and whether the added risk is justified by superior returns.

In this article, we dive deep into how these metrics work, why they matter, and how you can apply them to improve your investment analysis.

What Is Tracking Error?

Definition

Tracking Error measures the standard deviation of the difference between a portfolio’s returns and its benchmark returns. It quantifies how much a portfolio ‘deviates’ from its benchmark.

Formula

Tracking Error = sqrt( (1 / (n – 1)) * Σ(Rp,i – Rb,i)^2 )

Interpreting Tracking Error

Low tracking error (≤1-2%) = Passive strategy or index-hugging.
High tracking error (≥5-6%) = Aggressive active management.
A tracking error of 0 means the portfolio perfectly mimics the benchmark.

Real Example

Imagine a mutual fund benchmarked against the S&P 500. Over a year:
– Fund return = 12.1%
– S&P 500 return = 11.0%
Monthly differences: 1.1%, 0.9%, 1.3%, etc.
If the result is 3%, this means the fund deviated from the benchmark by about 3% on average, monthly.

What Is the Information Ratio?

Definition

The Information Ratio (IR) evaluates the risk-adjusted excess return of a portfolio relative to its benchmark. It tells you how much excess return the manager generates per unit of active risk (i.e., Tracking Error).

Formula

Information Ratio = (Rp – Rb) / Tracking Error

Interpreting IR Values

IR > 1: Excellent risk-adjusted performance.
IR = 0.5 to 1: Good.
IR < 0.5: Weak or inefficient use of risk.

Real Example

Let’s continue the previous scenario:
Portfolio return = 12.1%
Benchmark return = 11.0%
Tracking Error = 3%
IR = (12.1 – 11.0) / 3 = 0.366
This is a modest Information Ratio, suggesting the portfolio did beat the benchmark, but not efficiently given the risk.

Why These Metrics Matter for Investors

Practical Use Cases

Fund Selection: Choose managers who consistently deliver high IRs.
Risk Monitoring: Avoid funds with high tracking errors and low IRs — high risk, low reward.
Performance Attribution: Understand whether active management is actually adding value.

Active vs. Passive Management

These metrics highlight the trade-off between trying to beat the market and staying close to it. A passive ETF will have near-zero tracking error and IR. An active fund must justify its fees by delivering an attractive IR.

Pro Tip: Track These Metrics Yourself

Use Excel, Python, or Power BI to calculate your Tracking Error and Information Ratio monthly or quarterly. Retail investors can use Morningstar, Portfolio Visualizer, or brokerage analytics tools.

Final Thoughts

Tracking Error and Information Ratio are essential indicators of manager skill, portfolio consistency, and value creation. Used together, they allow you to judge whether the risk you’re taking is paying off.

Want More Insights Like This?

Stay ahead of the markets and receive free, high-quality trading alerts and investment tips each week.
👉 Subscribe to Our Free Newsletter

You may also be interested in …

🚀 Europe’s Silent Rally: Why Defense, Energy, and Industrial Stocks Are About to Outperform

🚀 Europe’s Silent Rally: Why Defense, Energy, and Industrial Stocks Are About to Outperform

Defense and energy giants are lighting up European markets — Rheinmetall, Balfour Beatty, and EQT are on fire as investors rush in following NATO’s historic 5% defense budget pledge and massive new energy contracts. From groundbreaking green infrastructure to record-breaking asset sales, opportunities are exploding.

This isn’t just noise. This is the spark before the breakout.

Inside our latest analysis, we dive deep into the numbers, technical setups, and key catalysts driving this surge — and we’re not just talking headlines. You’ll get clear multi-timeframe price targets, actionable insights, and smart stop-loss levels to protect your gains.

🔥 Don’t let this bull wave pass you by.
👉 Unlock your edge now at bullishstockalerts.com and turn insights into profits.

read more
🚨 Europe’s Auto Comeback: The Hidden Winners from the US-China Trade Truce

🚨 Europe’s Auto Comeback: The Hidden Winners from the US-China Trade Truce

European auto stocks just roared back, jumping 2% as the U.S. and China announced a breakthrough trade deal easing tariffs and rare earth restrictions. While most investors are still processing the news, the real opportunities are already forming—especially in the EV and tech-driven auto space.

In this detailed breakdown, we reveal high-potential price targets, strategic catalysts, and why this reset in global trade could mark the start of a powerful rally across Europe’s auto sector.

🚨 This could be the breakout moment the market’s been waiting for.
👉 Explore the full strategy and stock picks now at bullishstockalerts.com.

read more
🛢️ Oil’s Shock Collapse: Why This 12% Plunge Could Signal a Major Buying Opportunity

🛢️ Oil’s Shock Collapse: Why This 12% Plunge Could Signal a Major Buying Opportunity

Oil prices just suffered their worst weekly drop in over two years—down 12%—as the war premium vanished. But behind the panic lies a golden opportunity. With tight inventories, oversold technicals, and new catalysts emerging, the setup is ideal for a sharp rebound.

In this powerful market breakdown, we reveal short-, medium-, and long-term price targets, macroeconomic triggers, and why top traders are already positioning for the next move.

🔥 Want to know where oil is heading next—and how to profit from it?
👉 Visit bullishstockalerts.com for full access to the insight, strategies, and alerts you won’t find anywhere else.

read more
🚨 The Clock Is Ticking: Why This Market Shift Could Trigger the Next Big Trade

🚨 The Clock Is Ticking: Why This Market Shift Could Trigger the Next Big Trade

China’s sharp 9.1% drop in industrial profits signals more than just local economic stress—it’s a wake-up call for global investors. While deflation, tariffs, and overcapacity drag down Asia’s momentum, select European stocks are quietly gaining strength and market share.

This article uncovers one of the most compelling asymmetries in global markets: capital is fleeing East and heading West. With multi-timeframe price targets, technical breakouts, and bullish macro tailwinds, we break down which companies stand to benefit most—and how you can position yourself before the herd catches on.

🚨 Don’t wait for the next headline to tell you where the market is going.
👉 Get ahead now at bullishstockalerts.com – your edge starts here.

read more

0 Comments

Submit a Comment

Your email address will not be published. Required fields are marked *

An abstract, dynamic depiction of a bullish market trend, characterized by sharp, angular shapes in shades of gold and brown, suggesting upward movement and growth.

Join our newsletter for exclusive, high-value portfolio tips!

Unlock the secrets to a thriving portfolio with our exclusive newsletter! Be the first to receive cutting-edge investment tips, expert analysis, and insider insights that will elevate your investment strategy. Don’t miss out on the opportunity to maximize your returns – subscribe now and transform your financial future!

Thank you for subscribing! You're now on your way to receiving the best investment tips and market insights directly to your inbox.